|
PeakSimple
Software Features
|
87-88
|
|
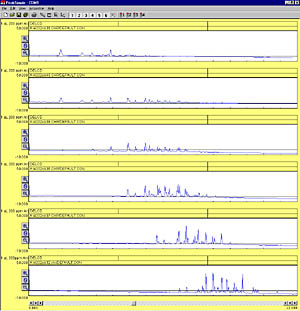
3D MULTIPLE CHROMATOGRAM DISPLAY Right-click
in any channel window to load its data into the 3D display feature.
Click on the 3D icon |
 |
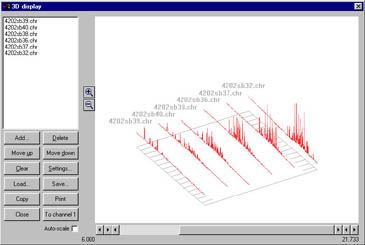
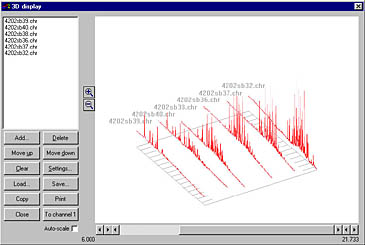
| The point of view may be placed anywhere on an imaginary sphere around the data, using the click-and-drag interface—almost like flying around the data in a helicopter. Grab the 3D display with your mouse and spin it around in real time. | 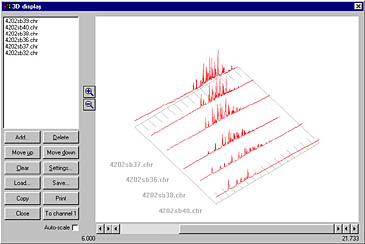 |
 |
 |
|
Magnify or reduce the 3D display by clicking on the Zoom icons to the left of the chromatogram display window. Print your 3D display, or copy it to your clipboard for pasting into Excel, Word, etc. |
|
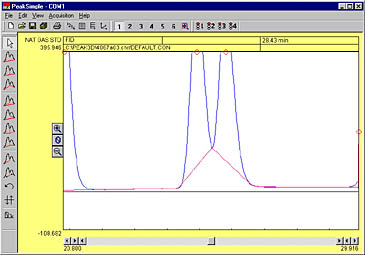
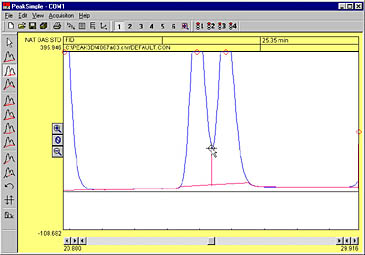
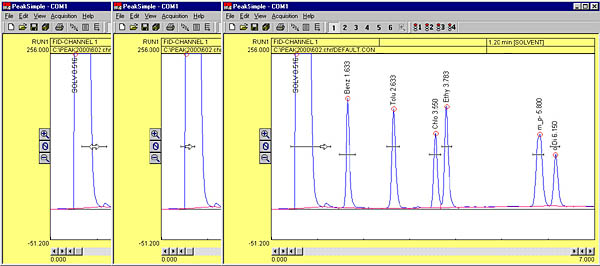
MANUAL
INTEGRATION
 |
 |
|
CONTROL
FILES
|
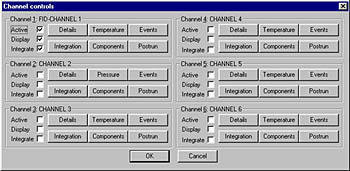 |
| Save any changes you make in an analysis to a control file and use it again and again for method reproducibility. Control files contain temperature or gradient programming, component external events, channel details, integration, postrun actions, and more! Create a control file for each method you typically perform. The number of control files you can have is limited only by your disk space. |
| PeakSimple Software Features |
87-88
|